Review


bms493  (Tocris)


Bioz Verified Symbol Tocris is a verified supplier
Bioz Manufacturer Symbol Tocris manufactures this product  
  • Logo
  • About
  • News
  • Press Release
  • Team
  • Advisors
  • Partners
  • Contact
  • Bioz Stars
  • Bioz vStars
  • 93

    Structured Review

    Tocris bms493
    (a) Schematic diagram of the reciprocal signalling environment of the embryo (left) and hTLS (right). (b) Relative information flow from CellChat analysis, identifying unique signalling interactions between the somite cell cluster and neural clusters (combined Neural progenitor populations 1-3 and Neuronal clusters). Dotted line indicates equal information flow = 0.5. (c) Localised expression of non-canonical Wnt (top) and RA (bottom) signalling components by HCR in 120h hTLS (left), as predicted from CellChat analysis (right). (d-e) Somite-specific ALDH1A2 expression adjacent to the neural tube, in 120h hTLS (d) and E9.5 mouse embryo (e) . (f-g) Projected images of hTLS at 120h following retinoic acid (RA) inhibition at 72h or 96h <t>(BMS493,</t> RA inhibitor). Structures were examined for differences in RA signalling ( ALDH1A2, CYP26A1) and neurogenesis ( DLL1 , NGN1 ; f ) or neural ( SOX2 , PAX6) and posterior tailbud ( WNT3A , FGF8) gene expression (g) . (h) Schematic diagram of proposed reciprocal signalling occurring between somites and the neural tube of hTLSs. Signals from the neural tube bias ALDH1A2 expression in the somites towards the neural tube (left), followed by subsequent RA signalling from somites to neural tube, leading to PAX6 expression biased towards the somitic side (right). RA, retinoic acid; IM, Intermediate mesoderm; LPM, Lateral plate mesoderm. Scale bars, 50 μm; * indicates somites; Dashed line outlines hTLS.
    Bms493, supplied by Tocris, used in various techniques. Bioz Stars score: 93/100, based on 117 PubMed citations. ZERO BIAS - scores, article reviews, protocol conditions and more
    https://www.bioz.com/result/bms493/product/Tocris
    Average 93 stars, based on 117 article reviews
    bms493 - by Bioz Stars, 2026-03
    93/100 stars

    Images

    1) Product Images from "Modelling co-development between the somites and neural tube in human Trunk-like Structures (hTLS)"

    Article Title: Modelling co-development between the somites and neural tube in human Trunk-like Structures (hTLS)

    Journal: bioRxiv

    doi: 10.1101/2024.12.16.628661

    (a) Schematic diagram of the reciprocal signalling environment of the embryo (left) and hTLS (right). (b) Relative information flow from CellChat analysis, identifying unique signalling interactions between the somite cell cluster and neural clusters (combined Neural progenitor populations 1-3 and Neuronal clusters). Dotted line indicates equal information flow = 0.5. (c) Localised expression of non-canonical Wnt (top) and RA (bottom) signalling components by HCR in 120h hTLS (left), as predicted from CellChat analysis (right). (d-e) Somite-specific ALDH1A2 expression adjacent to the neural tube, in 120h hTLS (d) and E9.5 mouse embryo (e) . (f-g) Projected images of hTLS at 120h following retinoic acid (RA) inhibition at 72h or 96h (BMS493, RA inhibitor). Structures were examined for differences in RA signalling ( ALDH1A2, CYP26A1) and neurogenesis ( DLL1 , NGN1 ; f ) or neural ( SOX2 , PAX6) and posterior tailbud ( WNT3A , FGF8) gene expression (g) . (h) Schematic diagram of proposed reciprocal signalling occurring between somites and the neural tube of hTLSs. Signals from the neural tube bias ALDH1A2 expression in the somites towards the neural tube (left), followed by subsequent RA signalling from somites to neural tube, leading to PAX6 expression biased towards the somitic side (right). RA, retinoic acid; IM, Intermediate mesoderm; LPM, Lateral plate mesoderm. Scale bars, 50 μm; * indicates somites; Dashed line outlines hTLS.
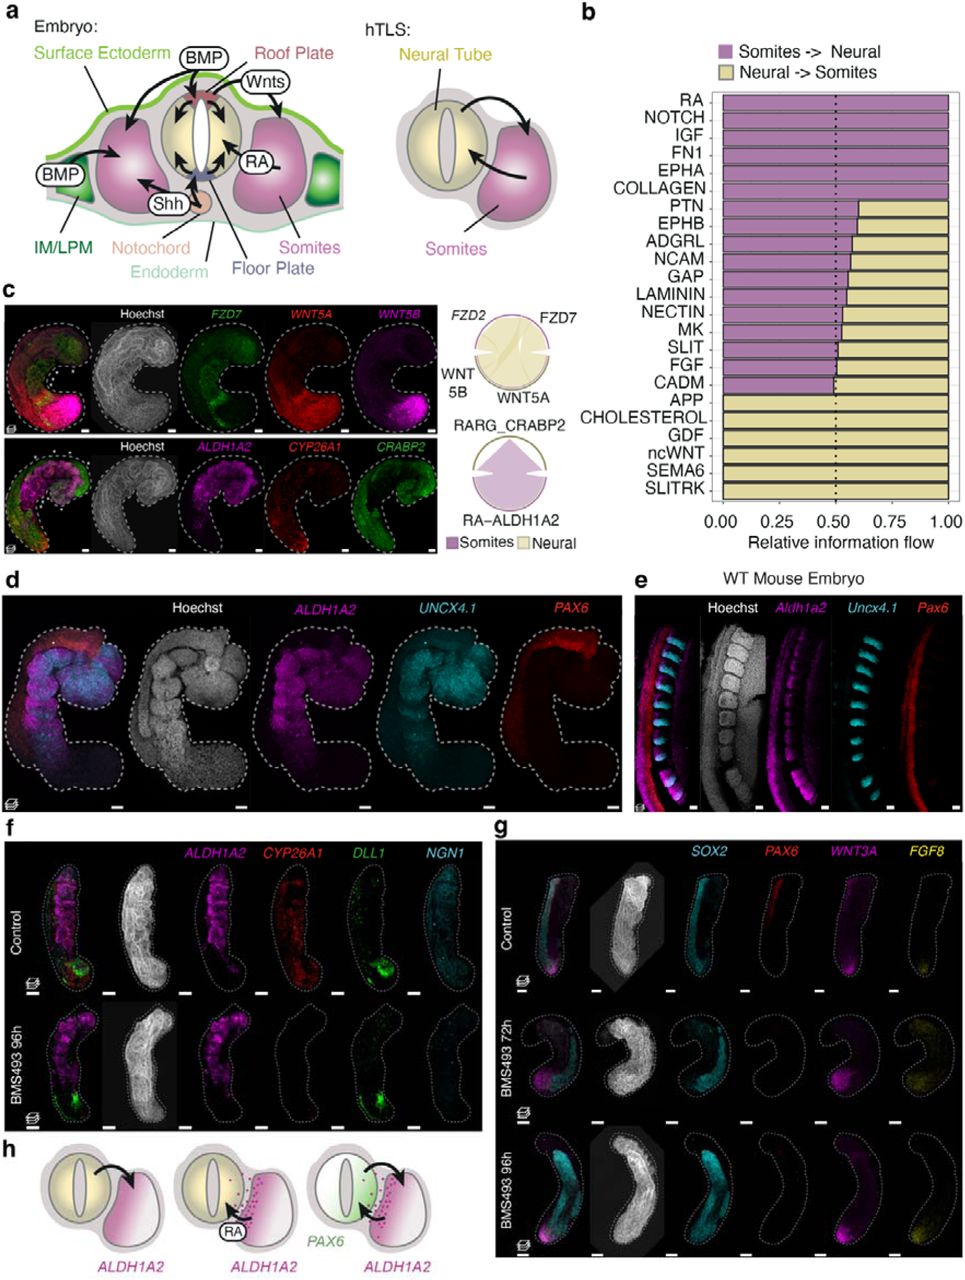
    Figure Legend Snippet: (a) Schematic diagram of the reciprocal signalling environment of the embryo (left) and hTLS (right). (b) Relative information flow from CellChat analysis, identifying unique signalling interactions between the somite cell cluster and neural clusters (combined Neural progenitor populations 1-3 and Neuronal clusters). Dotted line indicates equal information flow = 0.5. (c) Localised expression of non-canonical Wnt (top) and RA (bottom) signalling components by HCR in 120h hTLS (left), as predicted from CellChat analysis (right). (d-e) Somite-specific ALDH1A2 expression adjacent to the neural tube, in 120h hTLS (d) and E9.5 mouse embryo (e) . (f-g) Projected images of hTLS at 120h following retinoic acid (RA) inhibition at 72h or 96h (BMS493, RA inhibitor). Structures were examined for differences in RA signalling ( ALDH1A2, CYP26A1) and neurogenesis ( DLL1 , NGN1 ; f ) or neural ( SOX2 , PAX6) and posterior tailbud ( WNT3A , FGF8) gene expression (g) . (h) Schematic diagram of proposed reciprocal signalling occurring between somites and the neural tube of hTLSs. Signals from the neural tube bias ALDH1A2 expression in the somites towards the neural tube (left), followed by subsequent RA signalling from somites to neural tube, leading to PAX6 expression biased towards the somitic side (right). RA, retinoic acid; IM, Intermediate mesoderm; LPM, Lateral plate mesoderm. Scale bars, 50 μm; * indicates somites; Dashed line outlines hTLS.

    Techniques Used: Expressing, Inhibition


    Similar Products

    93
    MedChemExpress bms 493
    Bms 493, supplied by MedChemExpress, used in various techniques. Bioz Stars score: 93/100, based on 1 PubMed citations. ZERO BIAS - scores, article reviews, protocol conditions and more
    https://www.bioz.com/result/bms 493/product/MedChemExpress
    Average 93 stars, based on 1 article reviews
    bms 493 - by Bioz Stars, 2026-03
    93/100 stars
      Buy from Supplier

    93
    Tocris bms493
    (a) Schematic diagram of the reciprocal signalling environment of the embryo (left) and hTLS (right). (b) Relative information flow from CellChat analysis, identifying unique signalling interactions between the somite cell cluster and neural clusters (combined Neural progenitor populations 1-3 and Neuronal clusters). Dotted line indicates equal information flow = 0.5. (c) Localised expression of non-canonical Wnt (top) and RA (bottom) signalling components by HCR in 120h hTLS (left), as predicted from CellChat analysis (right). (d-e) Somite-specific ALDH1A2 expression adjacent to the neural tube, in 120h hTLS (d) and E9.5 mouse embryo (e) . (f-g) Projected images of hTLS at 120h following retinoic acid (RA) inhibition at 72h or 96h <t>(BMS493,</t> RA inhibitor). Structures were examined for differences in RA signalling ( ALDH1A2, CYP26A1) and neurogenesis ( DLL1 , NGN1 ; f ) or neural ( SOX2 , PAX6) and posterior tailbud ( WNT3A , FGF8) gene expression (g) . (h) Schematic diagram of proposed reciprocal signalling occurring between somites and the neural tube of hTLSs. Signals from the neural tube bias ALDH1A2 expression in the somites towards the neural tube (left), followed by subsequent RA signalling from somites to neural tube, leading to PAX6 expression biased towards the somitic side (right). RA, retinoic acid; IM, Intermediate mesoderm; LPM, Lateral plate mesoderm. Scale bars, 50 μm; * indicates somites; Dashed line outlines hTLS.
    Bms493, supplied by Tocris, used in various techniques. Bioz Stars score: 93/100, based on 1 PubMed citations. ZERO BIAS - scores, article reviews, protocol conditions and more
    https://www.bioz.com/result/bms493/product/Tocris
    Average 93 stars, based on 1 article reviews
    bms493 - by Bioz Stars, 2026-03
    93/100 stars
      Buy from Supplier

    95
    Tocris bms 493
    (a) Schematic diagram of the reciprocal signalling environment of the embryo (left) and hTLS (right). (b) Relative information flow from CellChat analysis, identifying unique signalling interactions between the somite cell cluster and neural clusters (combined Neural progenitor populations 1-3 and Neuronal clusters). Dotted line indicates equal information flow = 0.5. (c) Localised expression of non-canonical Wnt (top) and RA (bottom) signalling components by HCR in 120h hTLS (left), as predicted from CellChat analysis (right). (d-e) Somite-specific ALDH1A2 expression adjacent to the neural tube, in 120h hTLS (d) and E9.5 mouse embryo (e) . (f-g) Projected images of hTLS at 120h following retinoic acid (RA) inhibition at 72h or 96h <t>(BMS493,</t> RA inhibitor). Structures were examined for differences in RA signalling ( ALDH1A2, CYP26A1) and neurogenesis ( DLL1 , NGN1 ; f ) or neural ( SOX2 , PAX6) and posterior tailbud ( WNT3A , FGF8) gene expression (g) . (h) Schematic diagram of proposed reciprocal signalling occurring between somites and the neural tube of hTLSs. Signals from the neural tube bias ALDH1A2 expression in the somites towards the neural tube (left), followed by subsequent RA signalling from somites to neural tube, leading to PAX6 expression biased towards the somitic side (right). RA, retinoic acid; IM, Intermediate mesoderm; LPM, Lateral plate mesoderm. Scale bars, 50 μm; * indicates somites; Dashed line outlines hTLS.
    Bms 493, supplied by Tocris, used in various techniques. Bioz Stars score: 95/100, based on 1 PubMed citations. ZERO BIAS - scores, article reviews, protocol conditions and more
    https://www.bioz.com/result/bms 493/product/Tocris
    Average 95 stars, based on 1 article reviews
    bms 493 - by Bioz Stars, 2026-03
    95/100 stars
      Buy from Supplier

    90
    Tocris bms-493
    (a) Schematic diagram of the reciprocal signalling environment of the embryo (left) and hTLS (right). (b) Relative information flow from CellChat analysis, identifying unique signalling interactions between the somite cell cluster and neural clusters (combined Neural progenitor populations 1-3 and Neuronal clusters). Dotted line indicates equal information flow = 0.5. (c) Localised expression of non-canonical Wnt (top) and RA (bottom) signalling components by HCR in 120h hTLS (left), as predicted from CellChat analysis (right). (d-e) Somite-specific ALDH1A2 expression adjacent to the neural tube, in 120h hTLS (d) and E9.5 mouse embryo (e) . (f-g) Projected images of hTLS at 120h following retinoic acid (RA) inhibition at 72h or 96h <t>(BMS493,</t> RA inhibitor). Structures were examined for differences in RA signalling ( ALDH1A2, CYP26A1) and neurogenesis ( DLL1 , NGN1 ; f ) or neural ( SOX2 , PAX6) and posterior tailbud ( WNT3A , FGF8) gene expression (g) . (h) Schematic diagram of proposed reciprocal signalling occurring between somites and the neural tube of hTLSs. Signals from the neural tube bias ALDH1A2 expression in the somites towards the neural tube (left), followed by subsequent RA signalling from somites to neural tube, leading to PAX6 expression biased towards the somitic side (right). RA, retinoic acid; IM, Intermediate mesoderm; LPM, Lateral plate mesoderm. Scale bars, 50 μm; * indicates somites; Dashed line outlines hTLS.
    Bms 493, supplied by Tocris, used in various techniques. Bioz Stars score: 90/100, based on 1 PubMed citations. ZERO BIAS - scores, article reviews, protocol conditions and more
    https://www.bioz.com/result/bms-493/product/Tocris
    Average 90 stars, based on 1 article reviews
    bms-493 - by Bioz Stars, 2026-03
    90/100 stars
      Buy from Supplier

    95
    Tocris bms493 4 e
    (a) Schematic diagram of the reciprocal signalling environment of the embryo (left) and hTLS (right). (b) Relative information flow from CellChat analysis, identifying unique signalling interactions between the somite cell cluster and neural clusters (combined Neural progenitor populations 1-3 and Neuronal clusters). Dotted line indicates equal information flow = 0.5. (c) Localised expression of non-canonical Wnt (top) and RA (bottom) signalling components by HCR in 120h hTLS (left), as predicted from CellChat analysis (right). (d-e) Somite-specific ALDH1A2 expression adjacent to the neural tube, in 120h hTLS (d) and E9.5 mouse embryo (e) . (f-g) Projected images of hTLS at 120h following retinoic acid (RA) inhibition at 72h or 96h <t>(BMS493,</t> RA inhibitor). Structures were examined for differences in RA signalling ( ALDH1A2, CYP26A1) and neurogenesis ( DLL1 , NGN1 ; f ) or neural ( SOX2 , PAX6) and posterior tailbud ( WNT3A , FGF8) gene expression (g) . (h) Schematic diagram of proposed reciprocal signalling occurring between somites and the neural tube of hTLSs. Signals from the neural tube bias ALDH1A2 expression in the somites towards the neural tube (left), followed by subsequent RA signalling from somites to neural tube, leading to PAX6 expression biased towards the somitic side (right). RA, retinoic acid; IM, Intermediate mesoderm; LPM, Lateral plate mesoderm. Scale bars, 50 μm; * indicates somites; Dashed line outlines hTLS.
    Bms493 4 E, supplied by Tocris, used in various techniques. Bioz Stars score: 95/100, based on 1 PubMed citations. ZERO BIAS - scores, article reviews, protocol conditions and more
    https://www.bioz.com/result/bms493 4 e/product/Tocris
    Average 95 stars, based on 1 article reviews
    bms493 4 e - by Bioz Stars, 2026-03
    95/100 stars
      Buy from Supplier

    Image Search Results


    (a) Schematic diagram of the reciprocal signalling environment of the embryo (left) and hTLS (right). (b) Relative information flow from CellChat analysis, identifying unique signalling interactions between the somite cell cluster and neural clusters (combined Neural progenitor populations 1-3 and Neuronal clusters). Dotted line indicates equal information flow = 0.5. (c) Localised expression of non-canonical Wnt (top) and RA (bottom) signalling components by HCR in 120h hTLS (left), as predicted from CellChat analysis (right). (d-e) Somite-specific ALDH1A2 expression adjacent to the neural tube, in 120h hTLS (d) and E9.5 mouse embryo (e) . (f-g) Projected images of hTLS at 120h following retinoic acid (RA) inhibition at 72h or 96h (BMS493, RA inhibitor). Structures were examined for differences in RA signalling ( ALDH1A2, CYP26A1) and neurogenesis ( DLL1 , NGN1 ; f ) or neural ( SOX2 , PAX6) and posterior tailbud ( WNT3A , FGF8) gene expression (g) . (h) Schematic diagram of proposed reciprocal signalling occurring between somites and the neural tube of hTLSs. Signals from the neural tube bias ALDH1A2 expression in the somites towards the neural tube (left), followed by subsequent RA signalling from somites to neural tube, leading to PAX6 expression biased towards the somitic side (right). RA, retinoic acid; IM, Intermediate mesoderm; LPM, Lateral plate mesoderm. Scale bars, 50 μm; * indicates somites; Dashed line outlines hTLS.

    Journal: bioRxiv

    Article Title: Modelling co-development between the somites and neural tube in human Trunk-like Structures (hTLS)

    doi: 10.1101/2024.12.16.628661

    Figure Lengend Snippet: (a) Schematic diagram of the reciprocal signalling environment of the embryo (left) and hTLS (right). (b) Relative information flow from CellChat analysis, identifying unique signalling interactions between the somite cell cluster and neural clusters (combined Neural progenitor populations 1-3 and Neuronal clusters). Dotted line indicates equal information flow = 0.5. (c) Localised expression of non-canonical Wnt (top) and RA (bottom) signalling components by HCR in 120h hTLS (left), as predicted from CellChat analysis (right). (d-e) Somite-specific ALDH1A2 expression adjacent to the neural tube, in 120h hTLS (d) and E9.5 mouse embryo (e) . (f-g) Projected images of hTLS at 120h following retinoic acid (RA) inhibition at 72h or 96h (BMS493, RA inhibitor). Structures were examined for differences in RA signalling ( ALDH1A2, CYP26A1) and neurogenesis ( DLL1 , NGN1 ; f ) or neural ( SOX2 , PAX6) and posterior tailbud ( WNT3A , FGF8) gene expression (g) . (h) Schematic diagram of proposed reciprocal signalling occurring between somites and the neural tube of hTLSs. Signals from the neural tube bias ALDH1A2 expression in the somites towards the neural tube (left), followed by subsequent RA signalling from somites to neural tube, leading to PAX6 expression biased towards the somitic side (right). RA, retinoic acid; IM, Intermediate mesoderm; LPM, Lateral plate mesoderm. Scale bars, 50 μm; * indicates somites; Dashed line outlines hTLS.

    Article Snippet: For RA signalling manipulation of hTLS, retinal (RAL) was replaced with either DMSO or all trans -retinoic acid (100 nM; Sigma Aldrich, R2625); or treated with BMS493 (2.5 µM; Tocris 3509) at 72h during embedding.

    Techniques: Expressing, Inhibition